- Underbody panels
- Diffusers and wake regions
- Body surfaces
- Cooling and brake ducts
Application Domain 06
Automotive Aerodynamics
Exploring application-specific surface governance for external and internal vehicle flows.
Research-stage application · performance validation pending
Application Thesis
A governed architecture—not a universal surface treatment.
DDM treats cell geometry, spacing, orientation, density, and placement as application-dependent variables. Candidate configurations must be tuned to the local flow regime, surface geometry, operating envelope, materials, and performance objective.
Public descriptions communicate the research hypothesis and validation strategy. Detailed geometry ranges, configuration logic, and application-specific design rules remain controlled technical information.
Complete Visual Reference
View the full application overview sheet.
The complete sheet brings the application regions, candidate outcomes, flow mechanisms, design variables, materials, integration paths, and validation roadmap together in one technical visual.
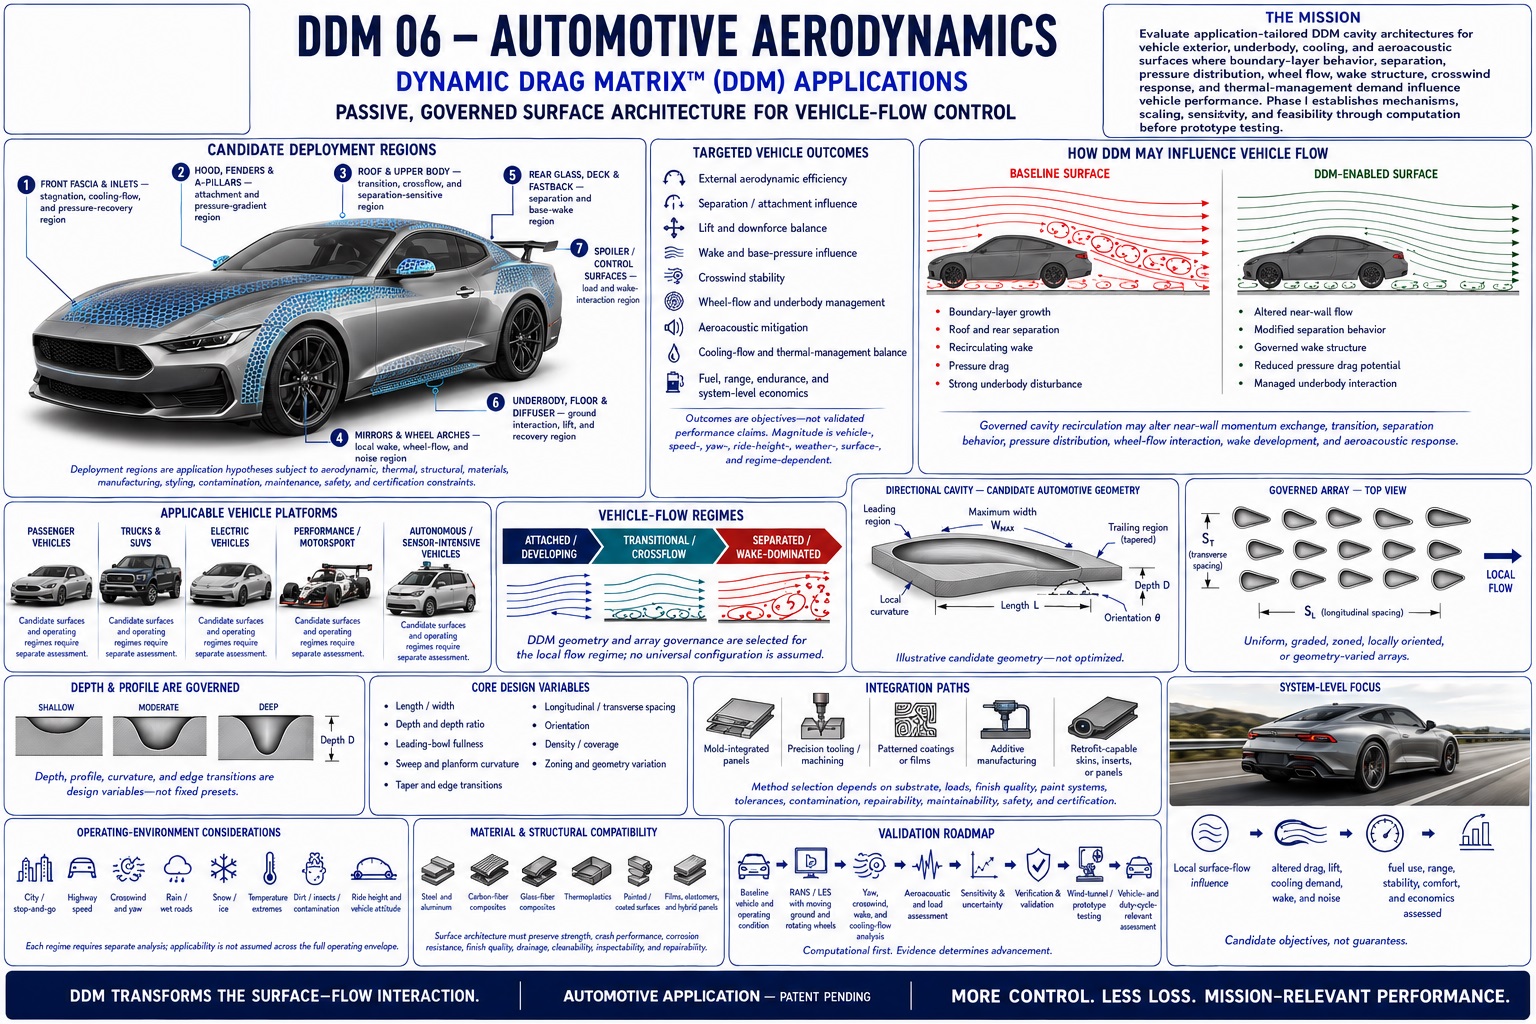 Click the sheet to open the full-resolution view ↗
Potential if Validated
Small vehicle-level gains can become enormous at production and fleet scale.
DDM is investigating whether governed surface architectures can influence underbody attachment, wheel-wake structure, diffuser inflow, rear pressure recovery, crosswind response, external noise, and cooling-air delivery. The value must be demonstrated at the complete-vehicle level: a local drag reduction is useful only if it survives rotating wheels, road clearance, yaw, cooling demand, contamination, and the certified drive cycle.
Govern local vehicle flow
Test attachment, separation, pressure distribution, wheel and mirror wakes, underbody turbulence, diffuser recovery, inlet distortion, and acoustic sources.
Reduce verified road load
Measure total drag and lift, aero balance, cooling flow, fan demand, crosswind response, noise, stability, and energy use over representative speeds and cycles.
Scale the result
Convert validated vehicle-level changes into fuel or electricity use, EV range, emissions, fleet cost, battery sizing, thermal performance, comfort, and product differentiation.
Where DDM Could Apply
One aerodynamic language across radically different road missions.
Every vehicle requires its own zonal design and full-envelope validation. Internal radiator, brake, battery, and HVAC passages connect to the Thermal Systems and Pipes & Ducts applications; this page evaluates their effect as part of the complete vehicle.
Passenger cars
Sedans, hatchbacks, coupes, and wagons where highway efficiency, wind noise, styling, cooling, manufacturing cost, and contamination tolerance converge.
Electric vehicles
Battery-electric sedans and crossovers where highway energy demand, usable range, thermal management, charging frequency, and battery mass are tightly coupled.
SUVs, pickups & vans
Larger bluff-body vehicles with underbody, wheel-wake, crosswind, cooling, towing, roof-accessory, and rear-wake challenges.
Commercial fleets
Delivery vans, buses, coaches, service vehicles, and other high-mileage platforms where small verified gains compound across vehicles and duty cycles.
Performance & motorsport
Sports cars, endurance racers, stock cars, and other platforms balancing drag, downforce, aero balance, brake cooling, speed, and regulatory limits.
Autonomous & specialty mobility
Robotaxis, sensor-equipped vehicles, emergency platforms, motorcycles, and purpose-built mobility systems with unusual external hardware and operating envelopes.
Representative Deployment Zones
DDM would target the vehicle's loss-producing flow structures.
- A
Front fascia and cooling entryStagnation, grille and intake flow, cooling demand, shutters, splitter regions, and upstream conditioning.
- B
Underbody and diffuserAttachment, ride-height sensitivity, ground interaction, pressure recovery, drag, lift, and aero-balance control.
- C
Wheels and wheel archesRotating-wheel wakes, pressure fluctuation, brake cooling, spray, debris, noise, and interaction with the underbody.
- D
A-pillars, mirrors, roof, and sensorsSeparation, crossflow, buffeting, cabin noise, sensor contamination, and accessory-induced drag.
- E
Rear deck, hatch, and wakeBase pressure, wake size and stability, spoiler inflow, separation control, rear lift, drag, and soiling.
Engineering Translation
Aerodynamic drag rises with the square of speed; required aerodynamic power rises with the cube.
That makes highway operation especially important, but total vehicle energy still includes rolling resistance, acceleration, grade, drivetrain losses, accessories, thermal management, weather, traffic, and regenerative braking. Drag reduction and fuel or range improvement are therefore not one-to-one.
Illustrative Fleet Opportunity
What vehicle-level fuel improvement could mean.
Assumed operating case: 1,000 high-mileage gasoline vehicles, each using 1,500 gallons annually, at an illustrative $3.50/gal. These are conditional calculations—not measured DDM results, a fuel-price forecast, or a guarantee of drive-cycle performance.
Conservative threshold
1%
vehicle-level fuel-use improvement
- Fleet fuel avoided annually
- 15,000 gal
- Illustrative annual value
- $52,500
- Combustion CO₂ avoided
- 133 metric tons
Target threshold
3%
vehicle-level fuel-use improvement
- Fleet fuel avoided annually
- 45,000 gal
- Illustrative annual value
- $157,500
- Combustion CO₂ avoided
- 400 metric tons
High-impact threshold
5%
vehicle-level fuel-use improvement
- Fleet fuel avoided annually
- 75,000 gal
- Illustrative annual value
- $262,500
- Combustion CO₂ avoided
- 667 metric tons
Illustrative EV Range Lens
What lower highway energy consumption could mean for a 300-mile EV.
If usable battery energy remains unchanged and validated vehicle energy consumption falls by 1%, 3%, or 5% at the defined highway condition, the mathematical range becomes approximately 303.0, 309.3, or 315.8 miles. Real rated and customer range depends on the entire drive cycle, speed, temperature, HVAC use, tires, battery limits, charging strategy, terrain, and degradation.
1%≈ +3.0 miles
3%≈ +9.3 miles
5%≈ +15.8 miles
Noise, Stability & Cooling Opportunity
Efficiency is only one part of the automotive value proposition.
If DDM testing demonstrates lower wind noise at the same speed and configuration, a 3 dB reduction corresponds to roughly 50% less sound power, 6 dB to 75% less, and 10 dB to 90% less. Cabin perception, tonal content, lift balance, crosswind steering response, radiator mass flow, fan power, brake temperature, and component durability require separate vehicle-level measurements.
−3 dB≈ 50% less sound power
−6 dB≈ 75% less sound power
−10 dB≈ 90% less sound power
The DDM Validation Gate
Automotive gains must survive the road—not only a clean CFD image.
DDM must demonstrate repeatable local-flow effects, then quantify complete-vehicle performance across speed, yaw, ride height, pitch, steering angle, rotating wheels, cooling demand, ground motion, rain, spray, dust, insects, ice, surface damage, manufacturing tolerance, cargo and towing configurations, roof accessories, thermal limits, stability, noise, and regulated drive cycles. Validation should progress from CFD and wind-tunnel work to coastdown, thermal, acoustic, track, and statistically controlled on-road testing.
Authoritative Benchmarks & Calculation Basis
EPA SmartWay — Verified Aerodynamic DevicesEPA reports that verified trailer aerodynamic devices can save up to 9% in fuel use, demonstrating the commercial leverage of validated drag reduction without implying the same result for DDM.Open official source ↗EPA — Highway Aerodynamic TranslationEPA reports a DOE benchmark in which a 10% reduction in aerodynamic drag corresponds to 5.5% highway fuel savings—evidence that drag improvement and vehicle fuel improvement are not one-to-one.Open official source ↗DOE — Coupled Aerodynamics & CoolingDOE vehicle research combines external drag, underhood thermal flow, component aerodynamics, fan-shroud optimization, simulation, and validation rather than treating body drag in isolation.Open official source ↗EPA — Gasoline CO₂ CalculationEPA uses 8.89 kg of combustion CO₂ per gallon of motor gasoline; that factor drives the illustrative fleet-emissions calculations below.Open official source ↗
Fleet arithmetic: 1.5 million gal/year baseline × modeled vehicle improvement; economic value uses $3.50/gal; combustion CO₂ uses EPA's 8.89 kg/gal factor. EV arithmetic: 300-mile baseline ÷ (1 − modeled energy-use improvement). All percentages are DDM research thresholds, not achieved performance.
Research Questions
What must be established before performance can be claimed.
Which regions offer useful flow control without creating new drag or noise sources?
How robust are effects to ride height, yaw, rain, dirt, and road damage?
Can passive treatments complement existing aerodynamic architecture?
Validation Path
From application hypothesis to defensible evidence.
- 01
Map vehicle-specific flow structures
- 02
Screen candidate zones computationally
- 03
Evaluate realistic off-design conditions
- 04
Advance candidates to scale-model and full-vehicle testing
Evidence status
No application-specific performance figures are presented here as demonstrated results. Quantitative claims will be published only when supported by traceable computational or experimental evidence and clearly stated boundary conditions.
Application-Specific Collaboration
Evaluate alignment with this research domain.
DDM welcomes conversations with government programs, laboratories, universities, OEMs, and technical partners.
Discuss this application