- Blade suction surfaces
- Root and transition regions
- Nacelle-adjacent flow
- Small and utility-scale platforms
Application Domain 04
Wind Turbine Blades
Evaluating passive surface governance across variable inflow, loading, and environmental exposure.
Research-stage application · performance validation pending
Application Thesis
A governed architecture—not a universal surface treatment.
DDM treats cell geometry, spacing, orientation, density, and placement as application-dependent variables. Candidate configurations must be tuned to the local flow regime, surface geometry, operating envelope, materials, and performance objective.
Public descriptions communicate the research hypothesis and validation strategy. Detailed geometry ranges, configuration logic, and application-specific design rules remain controlled technical information.
Complete Visual Reference
View the full application overview sheet.
The complete sheet brings the application regions, candidate outcomes, flow mechanisms, design variables, materials, integration paths, and validation roadmap together in one technical visual.
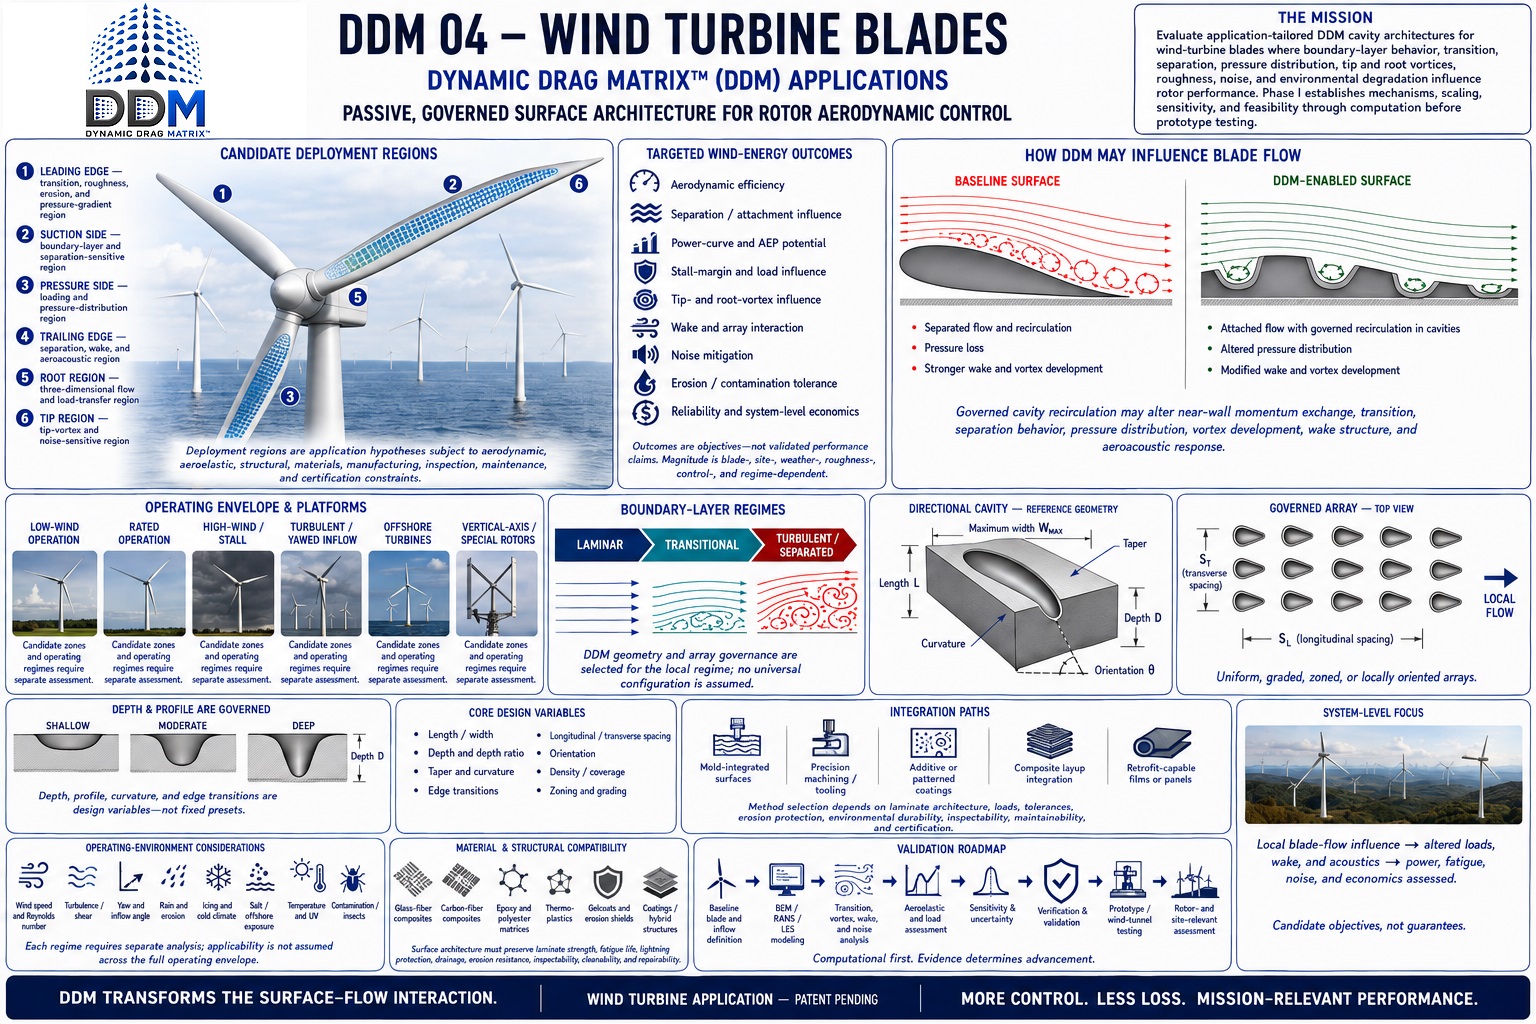 Click the sheet to open the full-resolution view ↗
Potential if Validated
More energy from the same wind resource can compound across an entire operating life.
DDM is investigating whether locally governed blade geometry can influence attachment, separation, pressure recovery, dynamic stall, tip-vortex structure, and flow-induced noise. Any benefit must persist through turbulent inflow, pitch and speed changes, rain, insects, salt, icing, erosion, and the structural demands of a rotating blade.
Govern local aerodynamics
Test lift, drag, separation, transition, stall onset, pressure fluctuation, and vortex behavior at selected blade stations and operating points.
Improve verified output
Measure rotor power, thrust, loads, acoustic response, control-system interaction, startup behavior, and the full power curve—not only a treated airfoil section.
Translate the result
Convert validated power-curve changes into annual energy production, revenue, capacity factor, loads, inspection intervals, repair exposure, and levelized-cost implications.
Where DDM Could Apply
One blade concept. Very different machines and wind climates.
Rotor blades belong here because the complete value case depends on turbine controls, rotating loads, the power curve, and annual energy production. Aircraft wings remain in Aerospace; fans, compressors, and other powered rotors remain in Rotating Machinery.
Utility-scale onshore
Large horizontal-axis turbines exposed to yaw error, atmospheric turbulence, insects, dust, rain, icing, and site-specific acoustic limits.
Utility-scale offshore
Long blades operating in salt, precipitation, high humidity, access-constrained maintenance conditions, and demanding marine wind fields.
Distributed & community wind
Small and midsize turbines where low-Reynolds-number behavior, startup, noise, reliability, and simple maintenance shape project value.
Vertical-axis turbines
Cross-flow architectures with cyclic angle of attack, dynamic stall, fatigue loading, and highly unsteady blade aerodynamics.
Airborne wind systems
Tethered wings and rotating airborne platforms where aerodynamic efficiency, control authority, mass, and durability are tightly coupled.
Research & repowering
Instrumented test turbines, replacement blades, and retrofit trials that can isolate performance, durability, and controls interactions.
Representative Deployment Zones
DDM would be tuned by span, chord, and operating objective.
- A
Leading edgeAttachment, contamination sensitivity, stall margin, and compatibility with erosion-protection systems.
- B
Mid-span suction surfaceLift, drag, transition, separation, and power-curve performance across dominant operating conditions.
- C
Root and transition regionLow-Reynolds-number flow, rotational effects, separation, startup behavior, and structural integration.
- D
Trailing-edge regionPressure recovery, wake structure, turbulent-boundary-layer noise, drainage, and manufacturability.
- E
Tip regionTip-vortex strength, induced loss, acoustic response, erosion exposure, lightning protection, and extreme-speed durability.
Engineering Translation
Annual value ≈ validated AEP change × realized energy value
A local lift or drag change is not automatically an annual-energy gain. The result must be propagated through rotor aerodynamics, controls, the measured power curve, the site wind-speed distribution, availability, electrical losses, curtailment, and degradation.
Illustrative Opportunity Model
What turbine-level AEP improvement could mean.
Assumed operating case: one turbine producing 10 GWh annually, with an illustrative energy value of $40/MWh; a 50-turbine project is shown for scale. These are conditional calculations—not measured DDM results, a power-price forecast, or a guarantee of turbine-level performance.
Conservative threshold
1%
turbine-level annual-energy improvement
- Additional energy annually
- 100 MWh
- Annual value per turbine
- $4,000
- 50-turbine annual value
- $200,000
Target threshold
3%
turbine-level annual-energy improvement
- Additional energy annually
- 300 MWh
- Annual value per turbine
- $12,000
- 50-turbine annual value
- $600,000
High-impact threshold
5%
turbine-level annual-energy improvement
- Additional energy annually
- 500 MWh
- Annual value per turbine
- $20,000
- 50-turbine annual value
- $1 million
Noise, Loads & Durability Opportunity
The strongest result may combine energy capture with operational resilience.
If DDM testing demonstrates lower flow-induced noise at the same operating condition, a 3 dB reduction corresponds to roughly 50% less sound power, 6 dB to 75% less, and 10 dB to 90% less. Community perception, tonal content, regulatory metrics, allowable rotor speed, fatigue life, erosion rate, and maintenance savings each require their own measurements.
−3 dB≈ 50% less sound power
−6 dB≈ 75% less sound power
−10 dB≈ 90% less sound power
The DDM Validation Gate
A promising airfoil result must survive rotation, weather, controls, and years of service.
DDM must first demonstrate repeatable sectional aerodynamic effects, then quantify turbine-level performance across Reynolds number, angle of attack, pitch, rotor speed, yaw, atmospheric turbulence, shear, gusts, contamination, rain, ice, salt, temperature, erosion, lightning systems, manufacturing tolerances, structural loads, controls, and off-design operation. Validation should progress from CFD and wind-tunnel testing to rotating rigs, instrumented turbines, and statistically defensible field trials.
Authoritative Benchmarks & Calculation Basis
DOE / Sandia — Leading-Edge ErosionDOE reports that light leading-edge erosion may reduce annual energy production by 5%, while heavy erosion may reduce it by as much as 25%—a benchmark for durability testing, not a DDM gain claim.Open official source ↗NREL — Leading-Edge Protection AnalysisNREL evaluates blade-protection decisions using annual-energy-production impact and repair-cost tradeoffs, reinforcing the need to measure both aerodynamic and maintenance consequences.Open official source ↗NREL — Wind-Plant Prediction BenchmarkNREL reports modern U.S. wind plants underperforming preconstruction annual-energy estimates by 3.5% to 4.5% after controlling for curtailment, highlighting the uncertainty surrounding small projected gains.Open official source ↗DOE WINDExchange — Wind EconomicsDOE reports a 2022 land-based wind LCOE reference of $39/MWh, with a $30–$57/MWh sensitivity range; the model below uses a rounded illustrative $40/MWh energy value.Open official source ↗
Scenario arithmetic: 10 GWh annual baseline × modeled AEP improvement; economic value uses an illustrative $40/MWh. The 1%, 3%, and 5% cases are DDM research thresholds, not achieved performance.
Research Questions
What must be established before performance can be claimed.
Can selected surface regions retain useful attachment across changing inflow?
How sensitive are candidate effects to contamination and leading-edge erosion?
Can gains survive realistic yaw, turbulence, and seasonal conditions?
Validation Path
From application hypothesis to defensible evidence.
- 01
Model representative blade sections
- 02
Screen placement and operating envelopes
- 03
Evaluate erosion and contamination sensitivity
- 04
Advance candidates to sectional and rotating tests
Evidence status
No application-specific performance figures are presented here as demonstrated results. Quantitative claims will be published only when supported by traceable computational or experimental evidence and clearly stated boundary conditions.
Application-Specific Collaboration
Evaluate alignment with this research domain.
DDM welcomes conversations with government programs, laboratories, universities, OEMs, and technical partners.
Discuss this application