- Blade and vane surfaces
- Casings and shrouds
- Inlet and exhaust ducts
- Diffusers and recovery regions
Application Domain 08
Rotating Machinery
Researching governed surfaces in compressors, turbines, fans, impellers, and blowers.
Research-stage application · performance validation pending
Application Thesis
A governed architecture—not a universal surface treatment.
DDM treats cell geometry, spacing, orientation, density, and placement as application-dependent variables. Candidate configurations must be tuned to the local flow regime, surface geometry, operating envelope, materials, and performance objective.
Public descriptions communicate the research hypothesis and validation strategy. Detailed geometry ranges, configuration logic, and application-specific design rules remain controlled technical information.
Complete Visual Reference
View the full application overview sheet.
The complete sheet brings the application regions, candidate outcomes, flow mechanisms, design variables, materials, integration paths, and validation roadmap together in one technical visual.
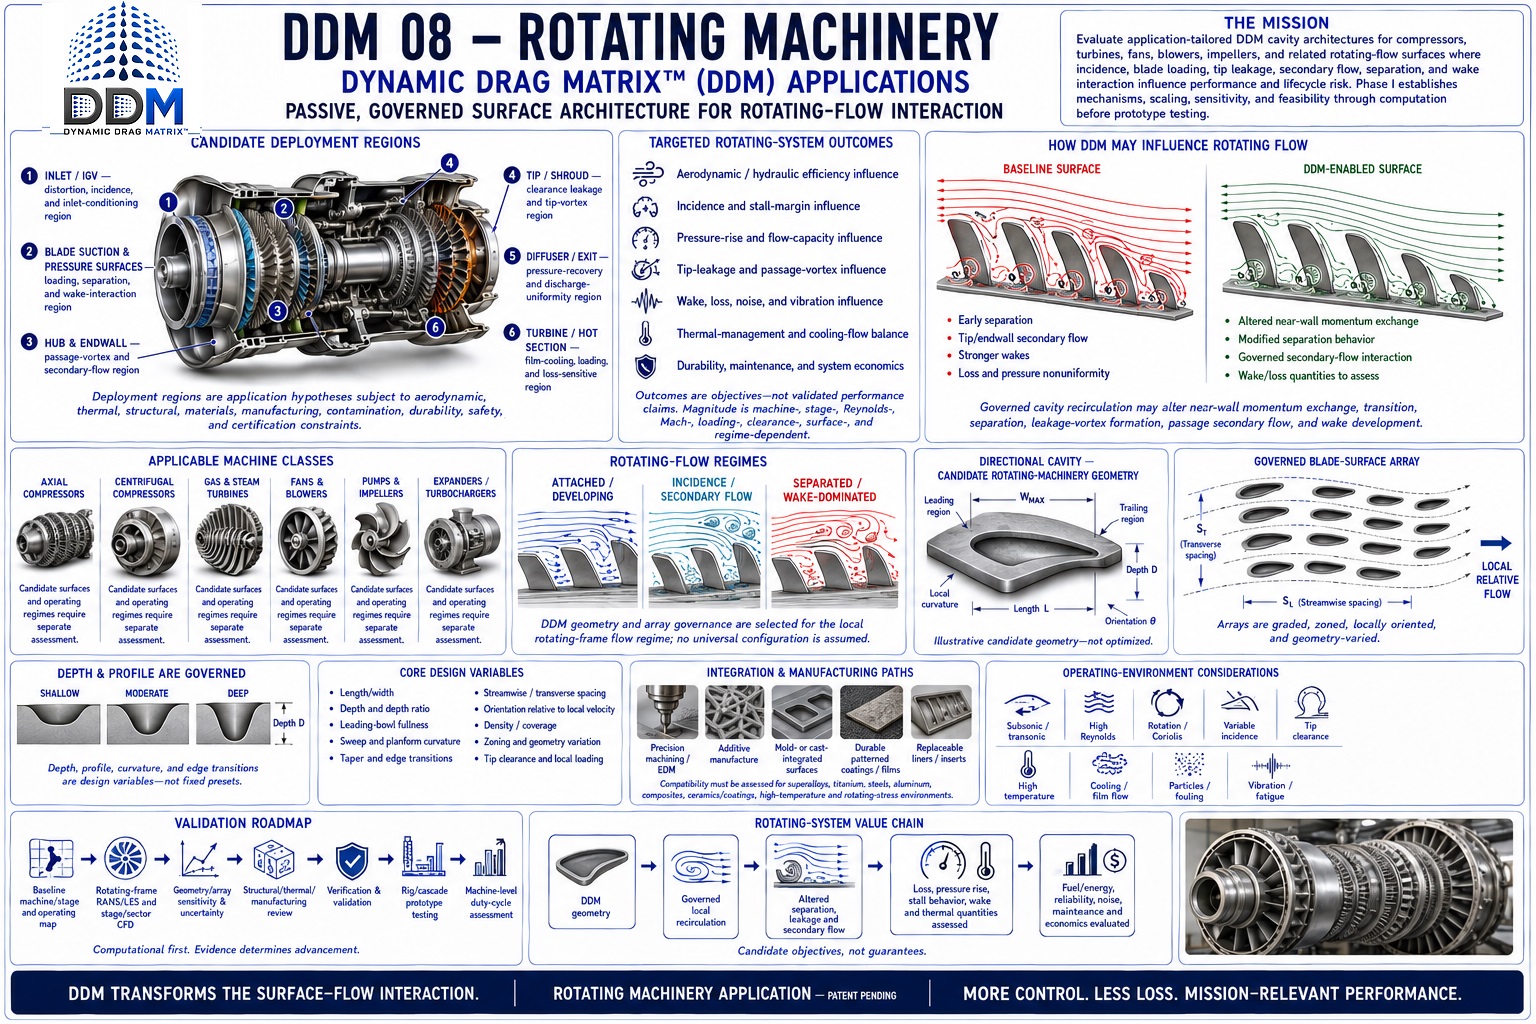 Click the sheet to open the full-resolution view ↗
Potential if Validated
Govern the flow where every revolution compounds the loss—or the opportunity.
DDM is investigating whether governed blade, vane, hub, shroud, casing, diffuser, and volute surfaces can influence separation, tip leakage, secondary flow, pressure recovery, stall, cavitation, pulsation, vibration, and aeroacoustic sources. The prize is machine-level efficiency and operating range, but local flow improvement counts only after it survives rotation, clearance, loading, temperature, erosion, and the complete system curve.
Govern loss-producing flow
Test boundary-layer attachment, blade loading, tip leakage, corner separation, secondary vortices, wake mixing, pressure fluctuation, and cavitation inception.
Improve verified performance
Measure efficiency, pressure ratio or head, flow capacity, surge and stall margin, torque, shaft power, temperature, vibration, noise, and full performance maps.
Translate the result
Convert supported machine-level changes into energy, throughput, fuel, uptime, bearing and seal exposure, maintenance intervals, emissions, and lifecycle economics.
Where DDM Could Apply
One geometric language across machines that move air, gas, steam, and liquid.
Each machine needs its own configuration and validation program. Wind-turbine rotors remain in Wind Energy; marine propellers and hydrofoils remain in Marine; this page focuses on powered rotating machinery and its stationary flow-path components.
Axial & centrifugal compressors
Industrial, process, refrigeration, pipeline, and propulsion compressors where separation, tip leakage, secondary flow, pressure ratio, surge margin, and temperature rise interact.
Gas & steam turbines
Power-generation, propulsion, and mechanical-drive turbines whose blade loading, cooling, leakage, erosion, deposits, temperature, vibration, and life limits must be evaluated together.
Fans & blowers
HVAC, cooling-tower, industrial-process, electronics-cooling, and ventilation machines where efficiency, delivered flow, tonal noise, broadband noise, size, and controls shape value.
Pumps & turbopumps
Municipal, chemical, oil-and-gas, power-plant, cryogenic, marine, and aerospace machines challenged by cavitation, inlet distortion, recirculation, pressure pulsation, and wear.
Turbochargers & expanders
Automotive, heavy-duty, industrial, refrigeration, and energy-recovery machines operating across fast transients, high speed, clearance sensitivity, thermal cycling, and off-design incidence.
Specialty rotating systems
Microturbomachinery, generators and motor-generator rotors, mixers, marine propulsors, and other rotating-flow devices requiring application-specific structural and fluid validation.
Representative Deployment Zones
Target the machine's loss mechanisms—not every available surface.
- A
Inlet, eye, and inducer regionFlow conditioning, swirl, incidence, distortion, recirculation, cavitation inception, and stable entry into the rotating row.
- B
Blade and vane suction surfacesBoundary-layer control, separation delay, stall behavior, profile loss, shock interaction, and off-design incidence.
- C
Pressure surfaces and trailing edgesLoading distribution, wake thickness, shedding, pressure pulsation, thermal exposure, and fatigue-sensitive forcing.
- D
Tips, hubs, shrouds, and endwallsLeakage, corner separation, secondary flow, clearance sensitivity, seal interaction, rubbing tolerance, and erosion.
- E
Diffusers, volutes, returns, and exhaustsPressure recovery, stall, tongue interaction, wake mixing, acoustic propagation, thermal gradients, and discharge uniformity.
Engineering Translation
A local loss reduction is not automatically the same percentage improvement in machine efficiency.
The result must be carried through mass flow, pressure ratio or head, torque, shaft speed, input power, leakage, mechanical and electrical losses, controls, duty cycle, and the system curve. Surge margin, cavitation margin, noise, vibration, and life are separate outcomes that require separate measurements.
Illustrative Energy Opportunity
What machine-level electrical improvement could mean.
Assumed operating case: one continuously utilized machine or train consuming 10 GWh annually, with electricity valued at an illustrative $0.10/kWh. A 20-machine facility is shown for scale. These are conditional calculations—not measured DDM results, an energy-price forecast, or a guarantee of system savings.
Conservative threshold
2%
machine-level electrical improvement
- Electricity avoided annually
- 200,000 kWh
- Annual value per machine
- $20,000
- 20-machine annual value
- $400,000
Target threshold
5%
machine-level electrical improvement
- Electricity avoided annually
- 500,000 kWh
- Annual value per machine
- $50,000
- 20-machine annual value
- $1 million
High-impact threshold
8%
machine-level electrical improvement
- Electricity avoided annually
- 800,000 kWh
- Annual value per machine
- $80,000
- 20-machine annual value
- $1.6 million
Capacity & Operating-Range Opportunity
Efficiency may be only one part of the business case.
If testing demonstrates greater stable flow, head, pressure ratio, stall margin, or cavitation margin at the same hardware and defined boundary conditions, the operator may gain throughput, turndown, transient tolerance, or reserve capacity. Those results must be shown on complete performance maps with identical corrections, controls, clearances, and uncertainty treatment—not inferred from a single design point.
ηefficiency across the map
ṁ / ΔPflow and pressure capability
SM / NPSHstall or cavitation margin
Noise, Vibration & Life Opportunity
Quieter flow can protect both people and hardware—but decibels require context.
If controlled testing demonstrates a 3 dB, 6 dB, or 10 dB reduction at the same operating condition, that corresponds to roughly 50%, 75%, or 90% less sound power. Tonal content, blade-passing frequency, vibration amplitude, bearing loads, seal behavior, cavitation erosion, crack initiation, and fatigue life require their own instrumentation and endurance evidence.
−3 dB≈ 50% less sound power
−6 dB≈ 75% less sound power
−10 dB≈ 90% less sound power
The DDM Validation Gate
The geometry must survive the complete rotating environment.
DDM must demonstrate repeatable local-flow effects, then quantify corrected machine and system performance across Reynolds and Mach regimes, speed, flow, pressure ratio or head, incidence, clearance, surge, stall, cavitation, transients, temperature, thermal cycling, vibration, centrifugal stress, erosion, corrosion, deposits, fouling, particles, lubrication, seals, manufacturing tolerance, cleaning, inspection, and off-design operation. Validation should progress from CFD and stationary passages to rotating rigs, full performance maps, acoustic and vibration testing, endurance runs, and controlled field pilots.
Authoritative Benchmarks & Calculation Basis
DOE — Pump-System EfficiencyDOE emphasizes that pump energy performance must be assessed at the system level and across the operating range, not inferred from one component or design point.Open official source ↗DOE — Centrifugal-Pump SelectionDOE notes that a few points of pump-efficiency improvement can save significant lifecycle energy and recommends matching the pump curve to the expected system curve near best efficiency.Open official source ↗NASA — Compressor Tip-Leakage FlowNASA research identifies compressor tip-leakage flow as a contributor to entropy generation, reduced peak pressure rise, and lower stall margin—supporting zone-specific measurement around tips and shrouds.Open official source ↗NASA — Advanced Noise Control FanNASA's ducted-fan research testbed measures fan-generated aeroacoustics, duct propagation, and far-field radiation, illustrating why machine noise requires controlled acoustic testing rather than visual flow inference.Open official source ↗
Energy arithmetic: 10 GWh annual baseline × modeled machine-level improvement; economic value uses $0.10/kWh. The 2%, 5%, and 8% cases are DDM research thresholds, not achieved performance. Acoustic percentages describe sound-power ratios only.
Research Questions
What must be established before performance can be claimed.
Can targeted arrays influence separation or secondary-flow losses?
How do rotation, clearance, vibration, erosion, and thermal loading affect viability?
Where can passive geometry complement existing machine design?
Validation Path
From application hypothesis to defensible evidence.
- 01
Characterize machine-specific loss regions
- 02
Screen stationary and rotating configurations
- 03
Assess structural and environmental constraints
- 04
Advance supported candidates to rig testing
Evidence status
No application-specific performance figures are presented here as demonstrated results. Quantitative claims will be published only when supported by traceable computational or experimental evidence and clearly stated boundary conditions.
Application-Specific Collaboration
Evaluate alignment with this research domain.
DDM welcomes conversations with government programs, laboratories, universities, OEMs, and technical partners.
Discuss this application