- Straight pipes, ducts, and distribution headers
- Elbows, tees, manifolds, reducers, and expanders
- Pump suction bells, intake cones, and upstream approach sections
- Diffusers, discharge ports, plenums, and recovery sections
- Waterjet tunnels, process lines, and slurry-compatible flow paths
Application Domain 03
Pipes, Ducts & Pump Intakes
Exploring governed internal surfaces for lower pressure loss, cleaner pump inflow, reduced cavitation risk, and more efficient fluid transport.
Research-stage application · performance validation pending
Application Thesis
A governed architecture—not a universal surface treatment.
DDM treats cell geometry, spacing, orientation, density, and placement as application-dependent variables. Candidate configurations must be tuned to the local flow regime, surface geometry, operating envelope, materials, and performance objective.
Public descriptions communicate the research hypothesis and validation strategy. Detailed geometry ranges, configuration logic, and application-specific design rules remain controlled technical information.
Complete Visual Reference
View the full application overview sheet.
The complete sheet brings the application regions, candidate outcomes, flow mechanisms, design variables, materials, integration paths, and validation roadmap together in one technical visual.
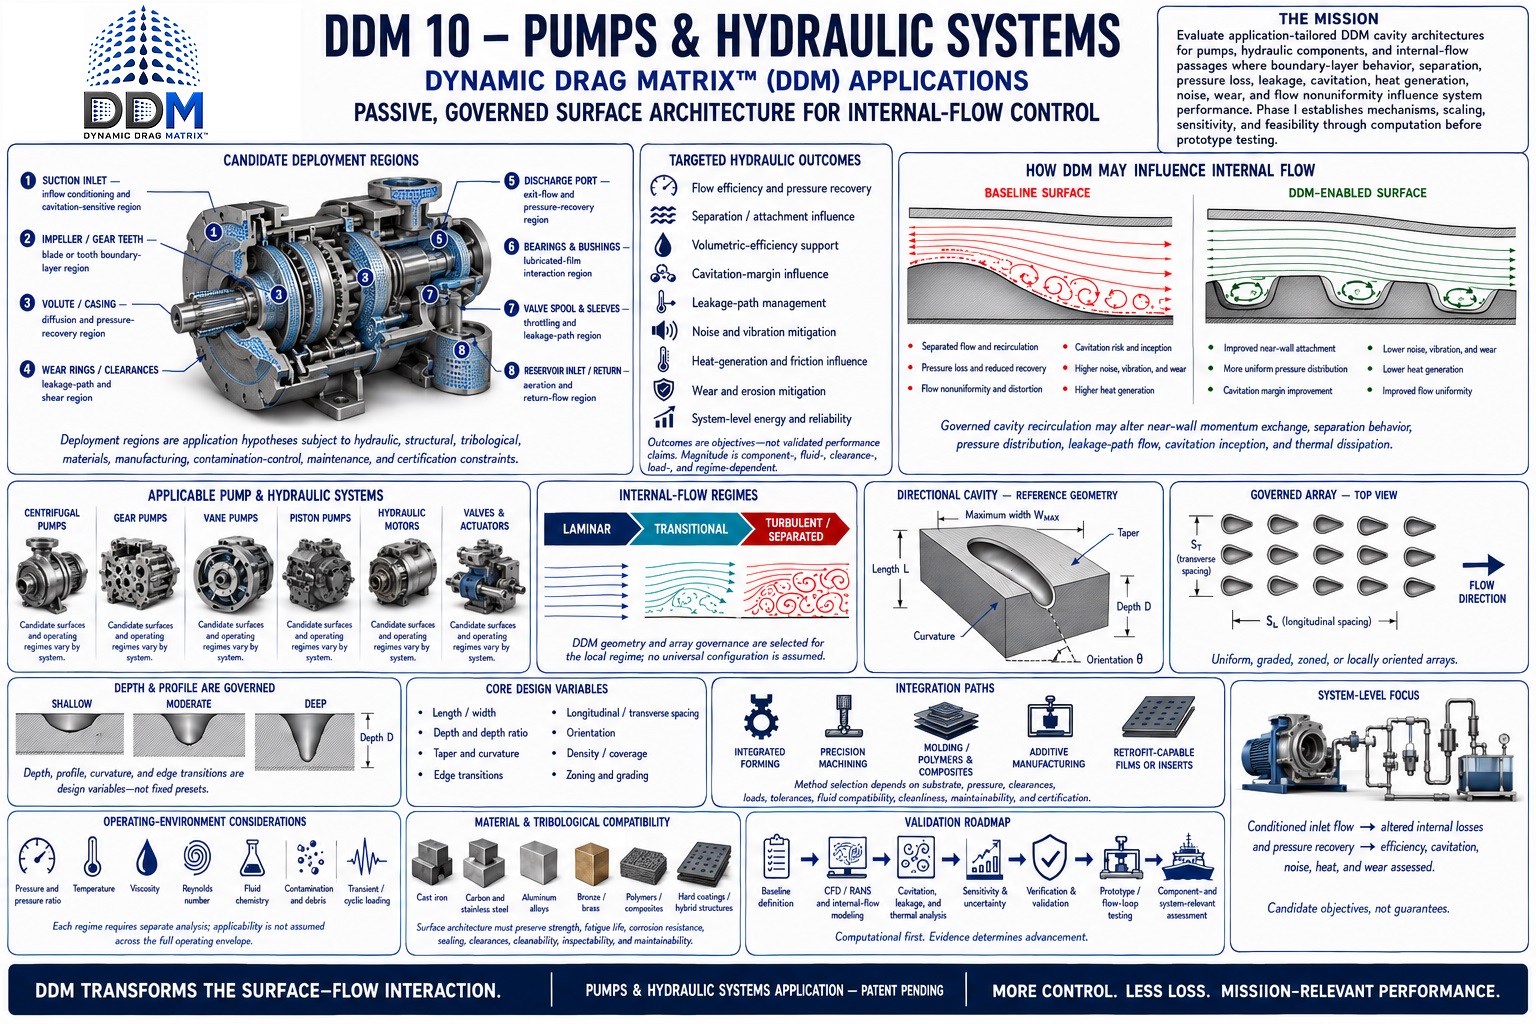 Click the sheet to open the full-resolution view ↗
Potential if Validated
Less pressure loss means less energy spent moving the same flow.
DDM is investigating whether governed internal geometry can reduce separation, recirculation, swirl, pressure loss, cavitation susceptibility, and flow nonuniformity at selected high-loss surfaces. The opportunity is not limited to a pump: it extends through the intake, fittings, pipe or duct network, recovery sections, and downstream equipment.
Govern high-loss zones
Test near-wall behavior, secondary flow, recirculation, inlet distortion, cavitation inception, and pressure recovery in representative components.
Reduce required head
Measure component loss coefficients, total dynamic head, pump or fan operating point, hydraulic efficiency, vibration, acoustic response, and throughput.
Translate the result
Convert validated system-level changes into electrical demand, operating cost, process capacity, equipment life, maintenance, reliability, and downtime value.
Where DDM Could Apply
From city-scale water networks to compact mission systems.
Every system requires application-specific geometry and placement. Pump impellers and other rotating blade surfaces remain part of the separate Rotating Machinery application; this page focuses on stationary internal-flow surfaces and pump approaches.
Municipal water systems
Raw-water intakes, drinking-water plants, booster stations, distribution headers, and high-duty centrifugal-pump installations.
Wastewater infrastructure
Lift stations, treatment-plant piping, aeration and recirculation loops, sludge handling, and fouling-prone flow paths.
Industrial process plants
Cooling-water loops, chemical processing, food and beverage lines, pulp and paper systems, and high-utilization transfer networks.
HVAC & air-handling systems
Supply and return ducts, elbows, transitions, plenums, fan approaches, and noise-sensitive occupied-building systems.
Mining, slurry & abrasive flow
Mineral transport, dredging, tailings, sand-bearing water, and other erosion- or deposition-sensitive applications.
Mobile & mission systems
Marine cooling and waterjets, aerospace environmental-control ducts, vehicle hydraulics, and compact high-power fluid systems.
Representative Deployment Zones
Target the losses—not every square inch of pipe.
- A
Straight runs and headersFrictional-loss and velocity-profile studies where duty cycle and length justify treatment.
- B
Elbows, tees, and manifoldsSeparation, secondary flow, swirl, vibration, and maldistribution control.
- C
Reducers, expanders, and transitionsPressure recovery, recirculation suppression, and smoother area change.
- D
Pump and fan approachesSuction bells, intake cones, upstream diameters, and other zones governing inflow distortion and cavitation margin.
- E
Diffusers, outlets, and plenumsDischarge conditioning, recovery, noise, mixing, and downstream flow uniformity.
Engineering Translation
Hydraulic power ≈ flow rate × pressure rise ÷ efficiency
At the same required flow and comparable equipment efficiency, reducing the portion of pressure rise consumed by verified system losses reduces required hydraulic power. Static head, controls, pump efficiency, and the untreated remainder of the network must be preserved in the full calculation.
Illustrative Opportunity Model
What system-level energy improvement could mean.
Assumed operating case: 10 GWh of annual electrical use at an illustrative $0.10/kWh. These are conditional calculations—not measured DDM results, an electricity-price forecast, or a guarantee of system-level performance.
Conservative threshold
2%
system-level energy-use improvement
- Electricity avoided annually
- 200,000 kWh
- Annual value per system
- $20,000
- Ten-system annual value
- $200,000
Target threshold
5%
system-level energy-use improvement
- Electricity avoided annually
- 500,000 kWh
- Annual value per system
- $50,000
- Ten-system annual value
- $500,000
High-impact threshold
10%
system-level energy-use improvement
- Electricity avoided annually
- 1 million kWh
- Annual value per system
- $100,000
- Ten-system annual value
- $1 million
Cavitation, Vibration & Noise Opportunity
Cleaner inflow may protect far more than the energy bill.
If DDM reduces inlet distortion, separation, or pressure fluctuation at the validated condition, the resulting value could include greater cavitation margin, lower vibration, reduced bearing and seal loading, improved process stability, and quieter operation. A measured 3 dB reduction corresponds to roughly 50% less sound power, 6 dB to 75% less, and 10 dB to 90% less; equipment life and maintenance consequences require separate endurance evidence.
−3 dB≈ 50% less sound power
−6 dB≈ 75% less sound power
−10 dB≈ 90% less sound power
The DDM Validation Gate
Internal-flow gains must survive the complete system curve.
DDM must demonstrate repeatable component-level improvement, then quantify system effects across Reynolds number, flow rate, pressure, temperature, viscosity, curvature, transient demand, surface roughness, scaling, fouling, corrosion, solids loading, multiphase flow, cleaning, and erosion. The tested geometry must not create unacceptable obstruction, clogging, contamination, maintenance, or off-design penalties.
Authoritative Benchmarks & Calculation Basis
DOE — Pumping System PerformanceDOE treats pump selection, pipe sizing, control losses, variable-speed operation, and system matching as connected energy-performance decisions.Open official source ↗DOE — Pipe Friction & Pumping CostDOE reports that lower-friction pipe surfaces can reduce friction factor by more than 40% in suitable applications, proportionately reducing friction-dominated pumping cost.Open official source ↗EPA — Water-Utility Energy EfficiencyEPA reports that energy can represent as much as 40% of drinking-water operating cost and that utility-wide efficiency programs can save 15% to 30%.Open official source ↗DOE — Pump Efficiency DegradationDOE reports that pump efficiency can degrade 10% to 25% before replacement, reinforcing the value of stable operation, monitoring, and durability.Open official source ↗
Scenario arithmetic: 10 GWh annual baseline × modeled system improvement; economic value uses $0.10/kWh. The percentages are DDM research thresholds, not achieved performance.
Research Questions
What must be established before performance can be claimed.
Can localized arrays improve disturbed-flow recovery or reduce separation losses?
How do roughness, deposition, and multiphase conditions change the response?
Where does added surface interaction outweigh any benefit?
Validation Path
From application hypothesis to defensible evidence.
- 01
Characterize baseline loss mechanisms
- 02
Study geometry and placement sensitivity
- 03
Test off-design and fouled conditions
- 04
Validate promising cases in instrumented flow loops
Evidence status
No application-specific performance figures are presented here as demonstrated results. Quantitative claims will be published only when supported by traceable computational or experimental evidence and clearly stated boundary conditions.
Application-Specific Collaboration
Evaluate alignment with this research domain.
DDM welcomes conversations with government programs, laboratories, universities, OEMs, and technical partners.
Discuss this application